07 Jul 2020 /
Mqondisi Bhebhe

Students studying economics come to our service every night, often looking for help in either constructing and interpreting graphs, or making calculations based on a number of economic variables.
 Image from @econ_comics on instagram
Since Economics is about how we make decisions when choosing among limited resources, we need to have a picture of what happens if we choose to have more/less of something and, no doubt, you will come across questions that say “explain what happens when one variable shifts from one point to another and illustrate that on a graph…”. Here are some of these frequently asked questions I come across regularly as one of Studiosity's Economics Specialists. I'll unpack the concepts that will give you a strong foundation in those areas.
1. Economic equilibrium
Many questions in Economics are about conditions that occur at/around 'equilibrium', and most of the students I encounter, although they can draw the graph/s, later fail to interpret/analyse them correctly in order to earn full marks.
The following illustrations will help you grasp the overall concept behind economic graphs and how we can use them to interpret most economic problems.
Many graphs in economics focus on the first quadrant (probably since most values are positive/realistic figures; we tend to avoid talking about -$5 since it doesn’t exist in physical quantities; it’s either I have money or I don’t!)
Points to note:
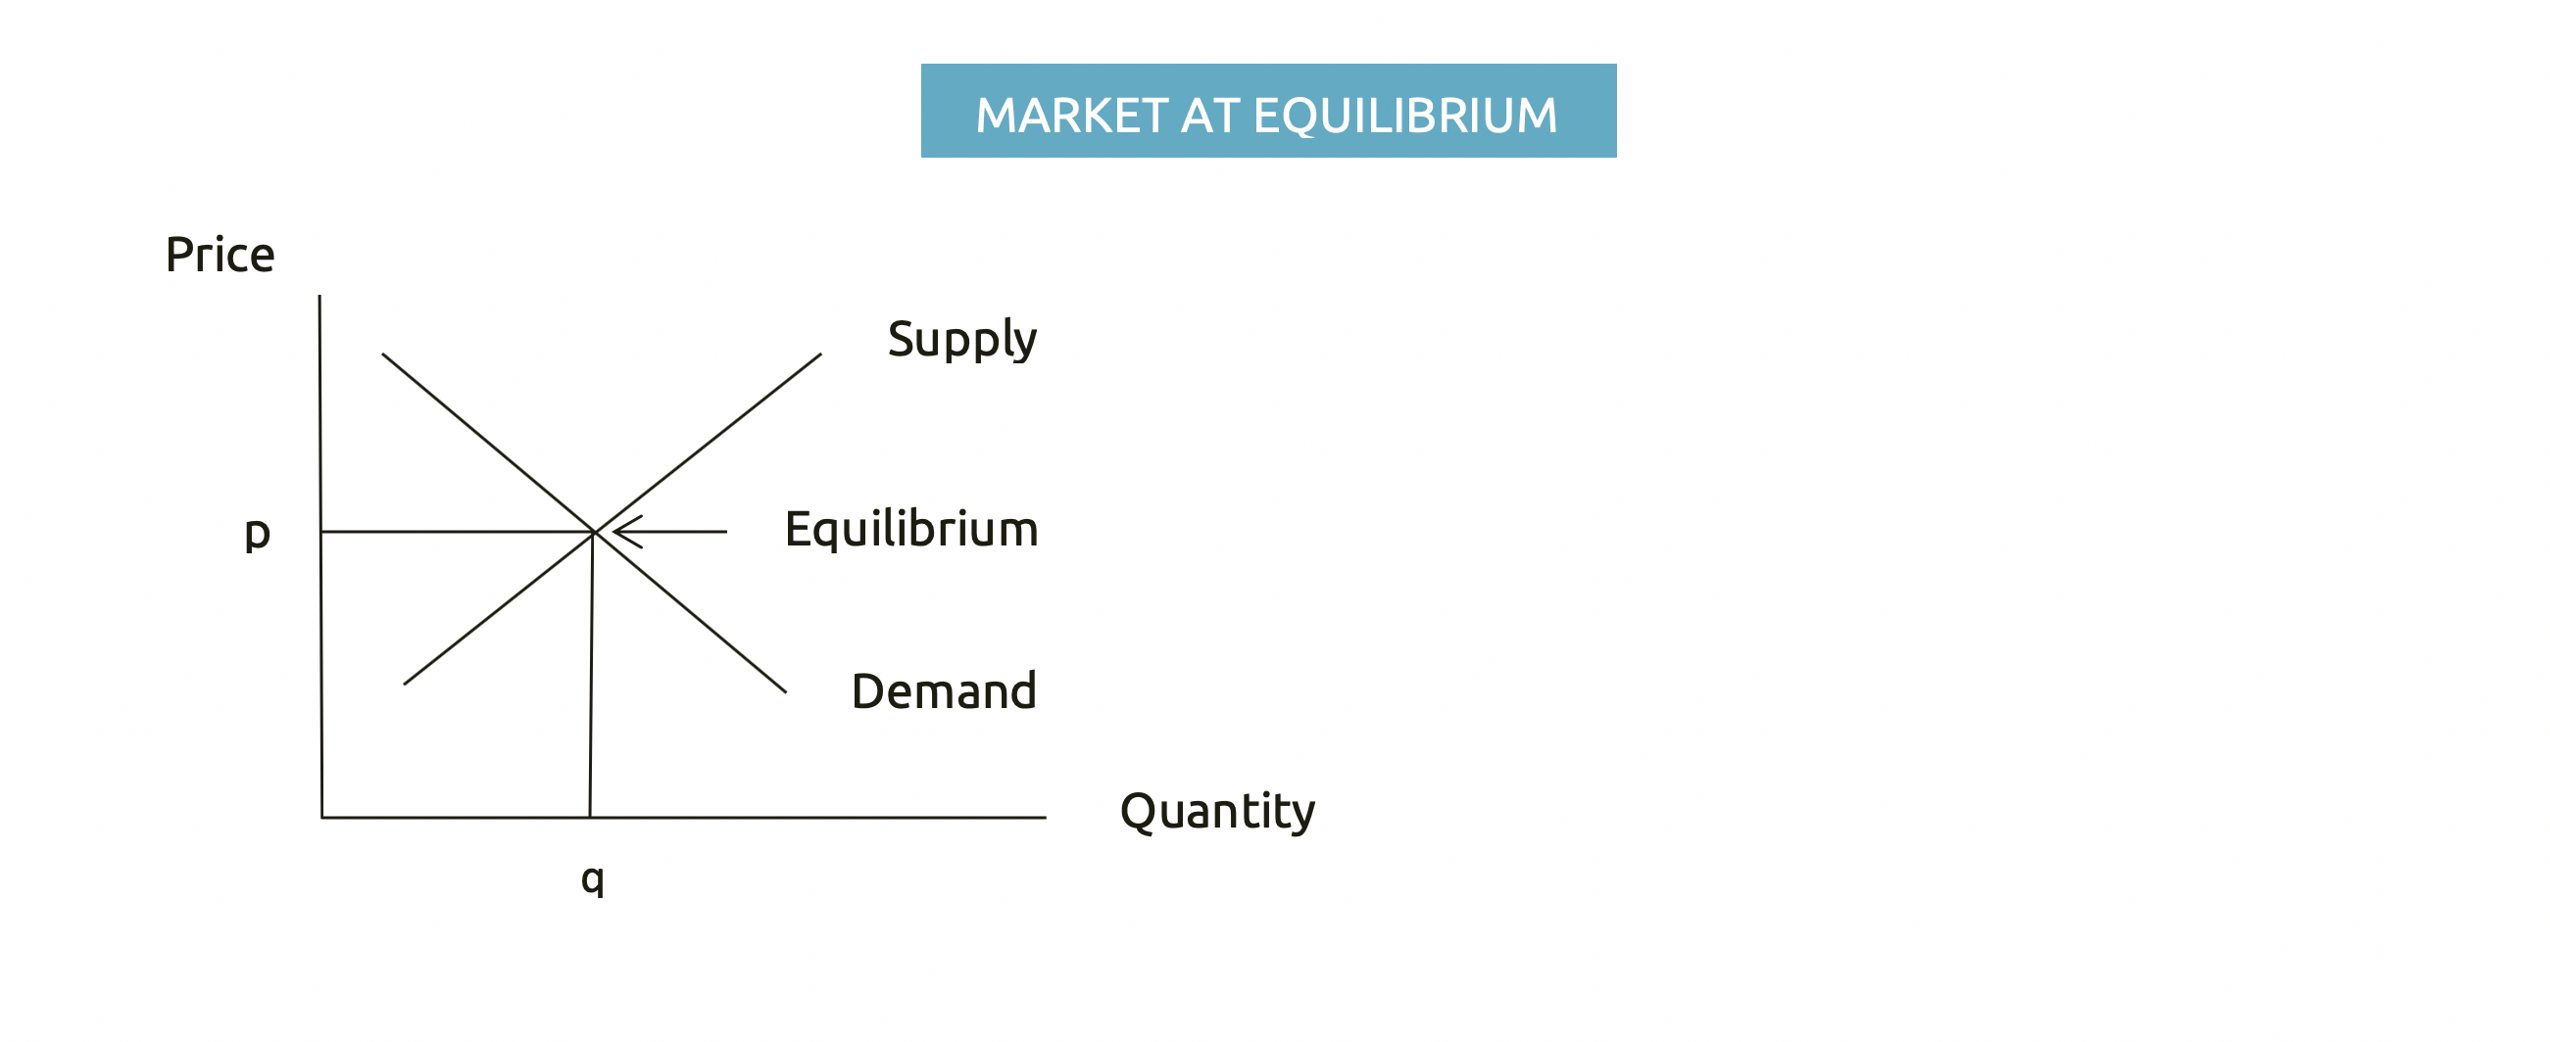
- Since we need to make a choice that combines what is available (Supply) and what is required (Demand), the equilibrium point must be where these two ‘forces’ meet (as illustrated).
- Prices increase vertically (up/down) while Quantities increase horizontally (from left to right).
- Consumers love lower prices; that is why the demand curve slopes downwards (from higher to lower prices) from left to right (fewer quantities to more)
- Suppliers make more profits when prices are high, which is why the Supply curve rises from left to right denoting more goods supplied as prices rise, and fewer units when prices fall.
Points to note:
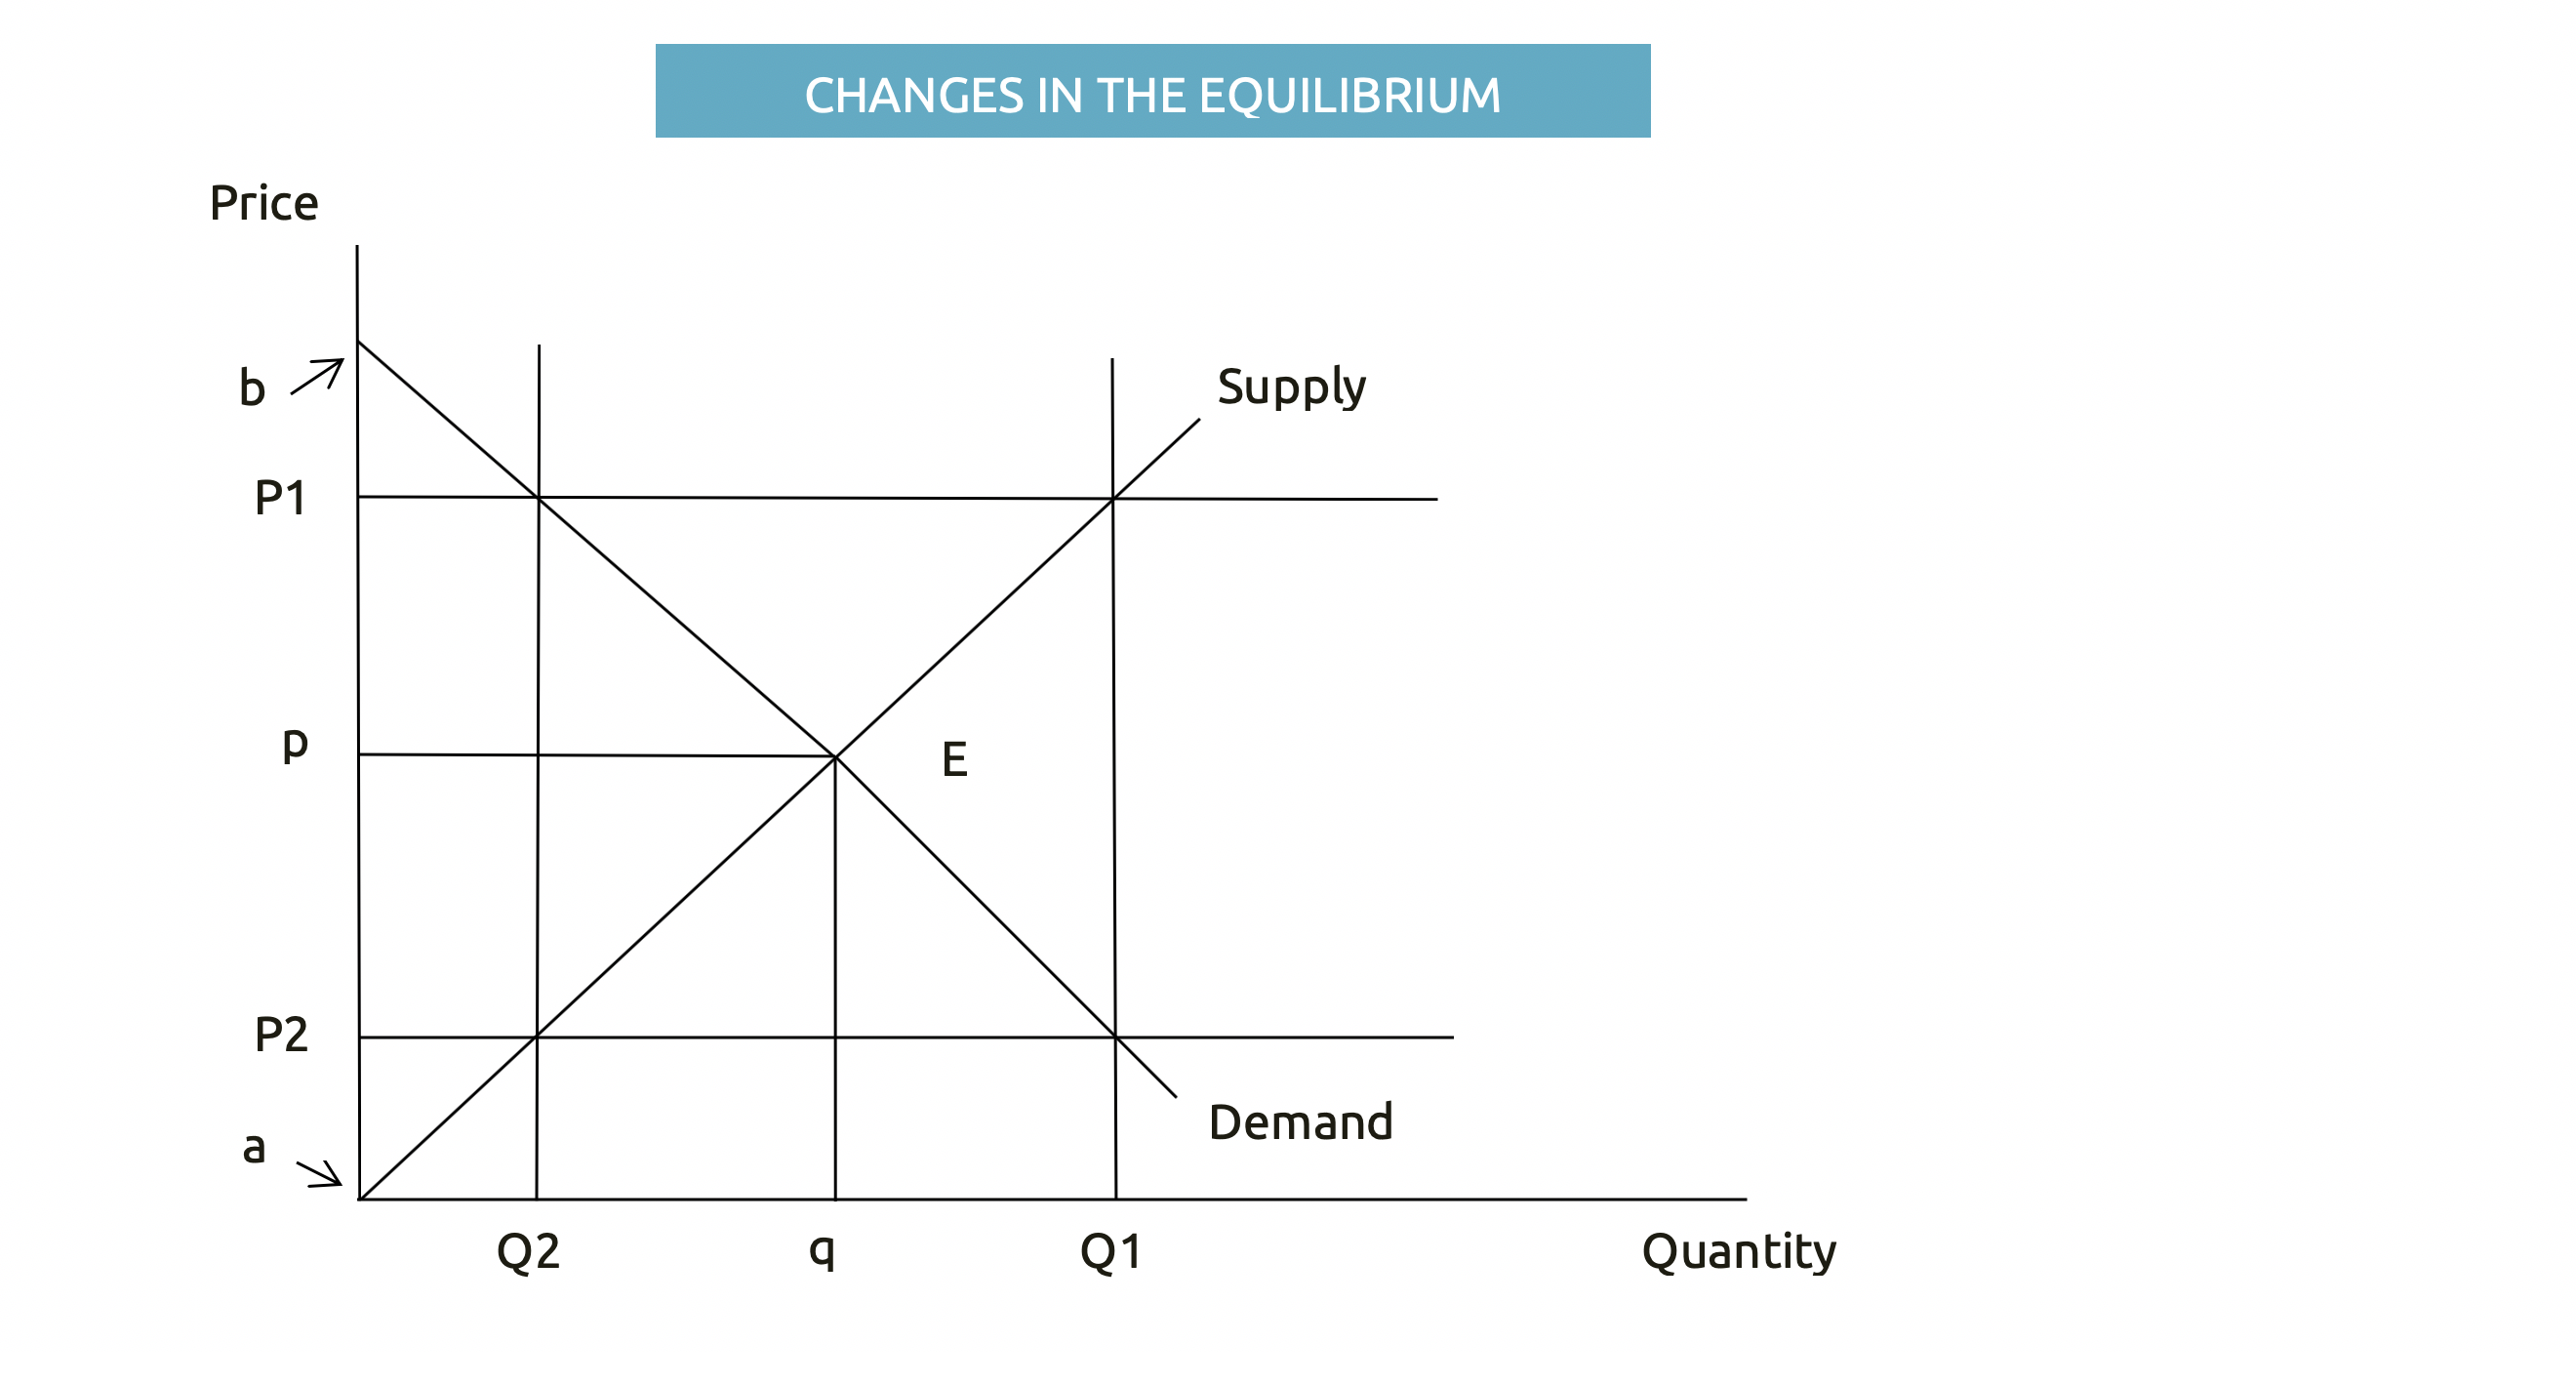
- P1 denotes a price above equilibrium; high prices encourage producers to supply more, leading to excess supply that outstrips demand (since not all producers are able to anticipate future demand).
- When price rises from p to P1, consumers hate price increases; they will start demanding only Q2 (down from q) while suppliers will be very happy and will increase supply from q to Q1. The difference between Q1 and Q2 is the excess supply.
- P2 shows the price that is lower than the prevailing equilibrium; it discourages suppliers and leads to very low production and shortages.
- When prices fall from p to P2, consumers will love that and demand more. Quantity demanded will increase from q to Q1 but suppliers will incur heavy losses if they produce more at lesser prices; they will reduce quantity supplied from q to Q2 and the difference between Q1 and Q2 represents a shortage in the industry.
2. Economic benefit
The total welfare to the overall economy can be measured by summing up the benefits to both consumers and suppliers in the above model.
Consumer surplus (CS) – represented by Triangle ‘bEp’; it denotes the amount that consumers were willing to pay but end up ‘saving’ after paying a lower price. The demand curve shows that the consumer was prepared to pay anything along the demand curve and by paying the equilibrium price, they ‘gained back’ what they had already given up which was above the equilibrium price but within the boundaries of the Demand Curve.
Producer surplus (PS) – represented by Triangle ‘aEp’; it denotes the amount that producers were willing to sell at but ended up gaining more after selling at an even higher price than initially targeted. The supply curve shows that the producer was prepared to sell along the supply curve and by getting the equilibrium price, they ‘gained more’ than what they had already given up which is below the market price but above the Supply Curve.
This economy gained the total of the above CS+PS (Triangle aEb).
3. Absolute vs. Comparative advantage
In international trade, many students ask me about why bigger countries often appear desperate to trade with poor, smaller states. Well, in order to improve the standards of living for local people, prices must be as low as possible for the best quality; that is why we do not care much about 'Absolute advantage' (the ability to produce more than the others) but 'Comparative advantage' (the ability to produce it cheaper than others). Countries will then sit down and compare their comparative advantages and see where the cheapest goods can be found.
Example: two countries Alpha and Beta are in a trading bloc and they want to see how they can maximise their benefits from the bilateral trade. They have the following production possibilities/capacities:
|
Goods |
Alpha |
Beta |
|
Oil |
100 |
60 |
|
Cars |
50 |
40 |
To an ordinary eye, Country Alpha is self-sufficient and has more resources than Beta (Absolute advantage). However, to improve their standards of living, they will need to see if they are paying the lowest price for those goods using comparative advantage:
- Oil =Country A Production possibilities/Country B’s
=100/60
=1.67 (Alpha is 1.67 times better at oil production than Beta)
- Cars =50/40
=1.25 (Alpha might be making more cars but they would be buying them cheaper if they were importing them from Beta)
The two governments can later on allow A to supply oil, while B will concentrate on cars since they both have better cost advantages over each other in those goods.Most questions will give you only the raw data and expect you to construct graphs, interpret them and propose solutions/alternative approaches, but don't worry, that's why we are here! If you're ever stuck on any problem in Economics or need help understanding a concept, connect with one of our expert online Economics Specialists, who are here 24/7 to provide all the help you need.
Check if your uni, school or TAFE offers Studiosity for free, or sign up now